GreenCharge
GreenCharge is a stand-alone Android Automotive application that helps EV users optimize home charging based on dynamic electricity tariffs and CO₂ emission forecasts. The application identifies up to four optimal charging windows within the next 24 hours while considering charging requirements and an optional departure time.
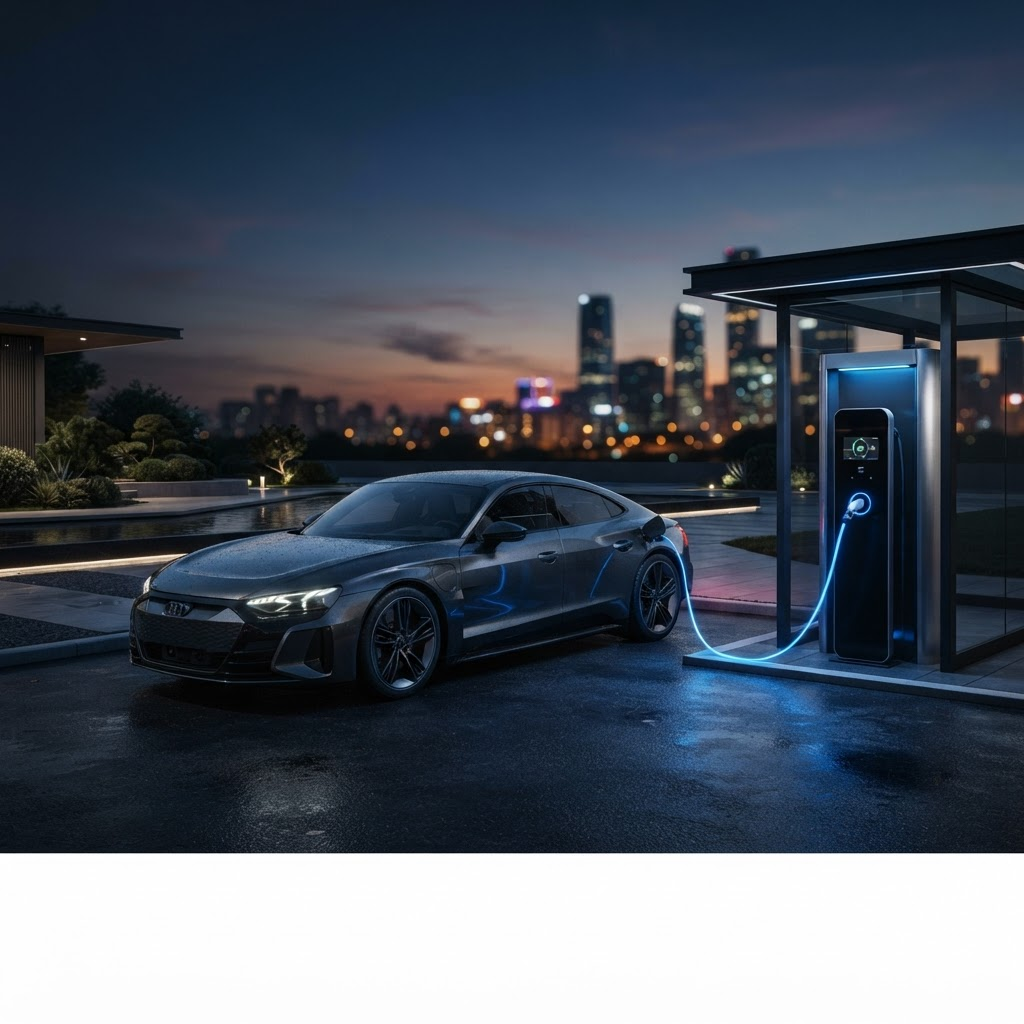
/Overview
GreenCharge transforms complex electricity price and CO₂ forecast data into a simple, actionable in-vehicle charging experience. The stand-alone Android Automotive app enables EV users to understand upcoming charging conditions, compare cost and emission optimization, configure charging parameters, define an optional departure time, and send a preferred charging schedule to the vehicle interface. The proof of concept focuses on dynamic home charging tariffs for the German market, with German and English localization.
/Business Challenge
Dynamic electricity tariffs and CO₂ intensity change throughout the day, making it difficult for EV users to determine when charging would be most economical or environmentally favourable. The UX challenge was to convert this complex forecast information into a glanceable 24-hour automotive visualization while considering vehicle state, charging power, battery capacity, required charging duration and an optional departure time. The solution also needed to demonstrate a complete UX/UI delivery capability — from requirements, user journeys and use cases through wireframes, design system, interaction states, specifications and developer handover. The vehicle-side charging interface is represented through an SDK or vehicle-interface mock for the proof of concept.
/Research
The UX analysis focused on understanding the charging decision, the information users need before scheduling charging, and the constraints that influence optimization. Requirements, charging scenarios and automotive interaction considerations were translated into user goals, tasks and use cases.
- Users should not need to manually interpret complex price and CO₂ forecasts.
- Charging recommendations must consider the required charging duration and configured vehicle parameters.
- Departure time can restrict the available optimization window and must be clearly communicated.
- Cost and CO₂ optimization require different decision criteria while maintaining a consistent interaction model.
- Loading, missing-data and transmission states are essential because the experience depends on backend and vehicle data.
- The interaction model must minimize cognitive load and unnecessary interaction in an in-vehicle environment.
/Competitive Benchmarking
Benchmarking focused on relevant interaction patterns from smart charging, energy optimization, EV and automotive infotainment experiences. The objective was not to replicate a specific product, but to identify effective patterns for presenting time-based forecast data, recommendations, configuration and system feedback.
- Dynamic energy tariff visualization
- Smart EV charging and scheduling experiences
- Automotive infotainment data visualization
- Time-based recommendation interfaces
- Charging configuration and scheduling patterns
- System status, error recovery and confirmation patterns
/Personas
Wants to reduce charging costs without manually monitoring dynamic electricity prices throughout the day.
Wants to charge when forecast CO₂ intensity is lower without having to interpret complex energy data.
Wants to configure charging power, battery capacity, minimum SOC and departure time so recommendations reflect her vehicle and charging situation.
/User Journey
From “How much will charging cost?” to “When should I charge?”, GreenCharge transforms a complex energy decision into a simple, guided in-vehicle experience.
/Information Architecture
The information architecture is organized around four primary sections: Cost, Emission, Setup and Legal. Cost and Emission provide the primary optimization experiences, Setup contains charging and vehicle parameters that influence the recommendation, and Legal provides required information such as imprint, terms and licenses. A consistent navigation structure allows users to move between the sections without changing their mental model.
/Task Flow
Three primary task flows were defined: cost-optimized charging, charging configuration and CO₂-optimized charging. The main interaction follows a consistent pattern — retrieve data, understand the forecast, review the recommendation, optionally modify constraints, and confirm the preferred charging schedule. Departure time and charging parameters are treated as optimization constraints rather than separate complex workflows.
/Wireframes
/High-Fidelity Designs
/Design System
A lightweight project-specific Figma design system was created to ensure visual and interaction consistency across the GreenCharge experience. The system is structured around reusable foundations, components, states and variables that can be handed over to development and extended as the application evolves.
- Color tokens for cost, emission, recommendation, restricted and system states
- Typography hierarchy optimized for a 1920 × 1080 automotive display
- 8-point spacing system and defined layout grid
- Reusable navigation, button, input, chart, dialog and feedback components
- Cost and emission chart components with reusable states
- Loading, error, disabled, selected, processing and success variants
- German and English localization considerations including text expansion
- Figma component naming and specification conventions for developer handover
/Accessibility
The interface was designed for an in-vehicle environment where glanceability, readability and interaction simplicity are critical. Visual hierarchy and interaction patterns were optimized to communicate charging recommendations without increasing driver workload.
/Developer Handover
The final Figma delivery connects UX requirements directly to implementation, giving developers a single source of truth for screens, components, states and interaction behaviour. Specifications were structured around the functional requirements and edge cases identified during the UX process.
/Results
- Established a complete UX/UI concept for cost- and CO₂-optimized home charging.
- Defined a 24-hour visualization model capable of presenting up to four optimal charging windows.
- Created an end-to-end interaction model covering optimization, configuration and charging schedule transmission.
- Delivered a reusable Figma design system with components, tokens, states and developer-ready specifications.
- Created a traceable UX delivery framework connecting user goals, use cases, screens, interactions, states and functional requirements.
- Established a foundation for subsequent Android Automotive implementation, vehicle-interface integration and in-vehicle validation.
/Reflection
The biggest UX challenge was not visualizing electricity prices or CO₂ data, but deciding how much complexity the user should ever have to see. GreenCharge demonstrates that the system can perform the complex optimization in the background while the interface focuses on making the recommendation understandable, controllable and trustworthy. The experience is designed to say less, show what matters, and give the driver a clear path from forecast to charging decision.
Personalization Platform
Software Defined Vehicle